Positional encoding In Transformer
Contents
Positional encoding in Transformer
Positional encoding in Transformer
criteria
Ideally, the following criteria should be satisfied
- It should output a unique encoding for each time-step
- Distance between any two time-steps should be consistent across sentences with different lengths
- out model should generalize to longer sentences without any efforts. Its values should be bounded
- It must be deterministic
Proposed method
\[ P(k, 2i) = \sin(\frac{k}{n^{2i/d}}) \] \[ P(k, 2i + 1) = \cos(\frac{k}{n^{2i/d}}) \] k: position of an object input sequence, \(0 \leq k < L/2\) d: Dimension of the output embedding space P(K, j): Position function for mapping a position k in the input sequence to index(k, j) of the positional matrix) n: User defined scalar. Set to 10000 by the authors of Attention Is All You Need i: Used for mapping to column indices \(0 \leq i < d/2\). A single value of i maps to both sine and cosine functions.
Example
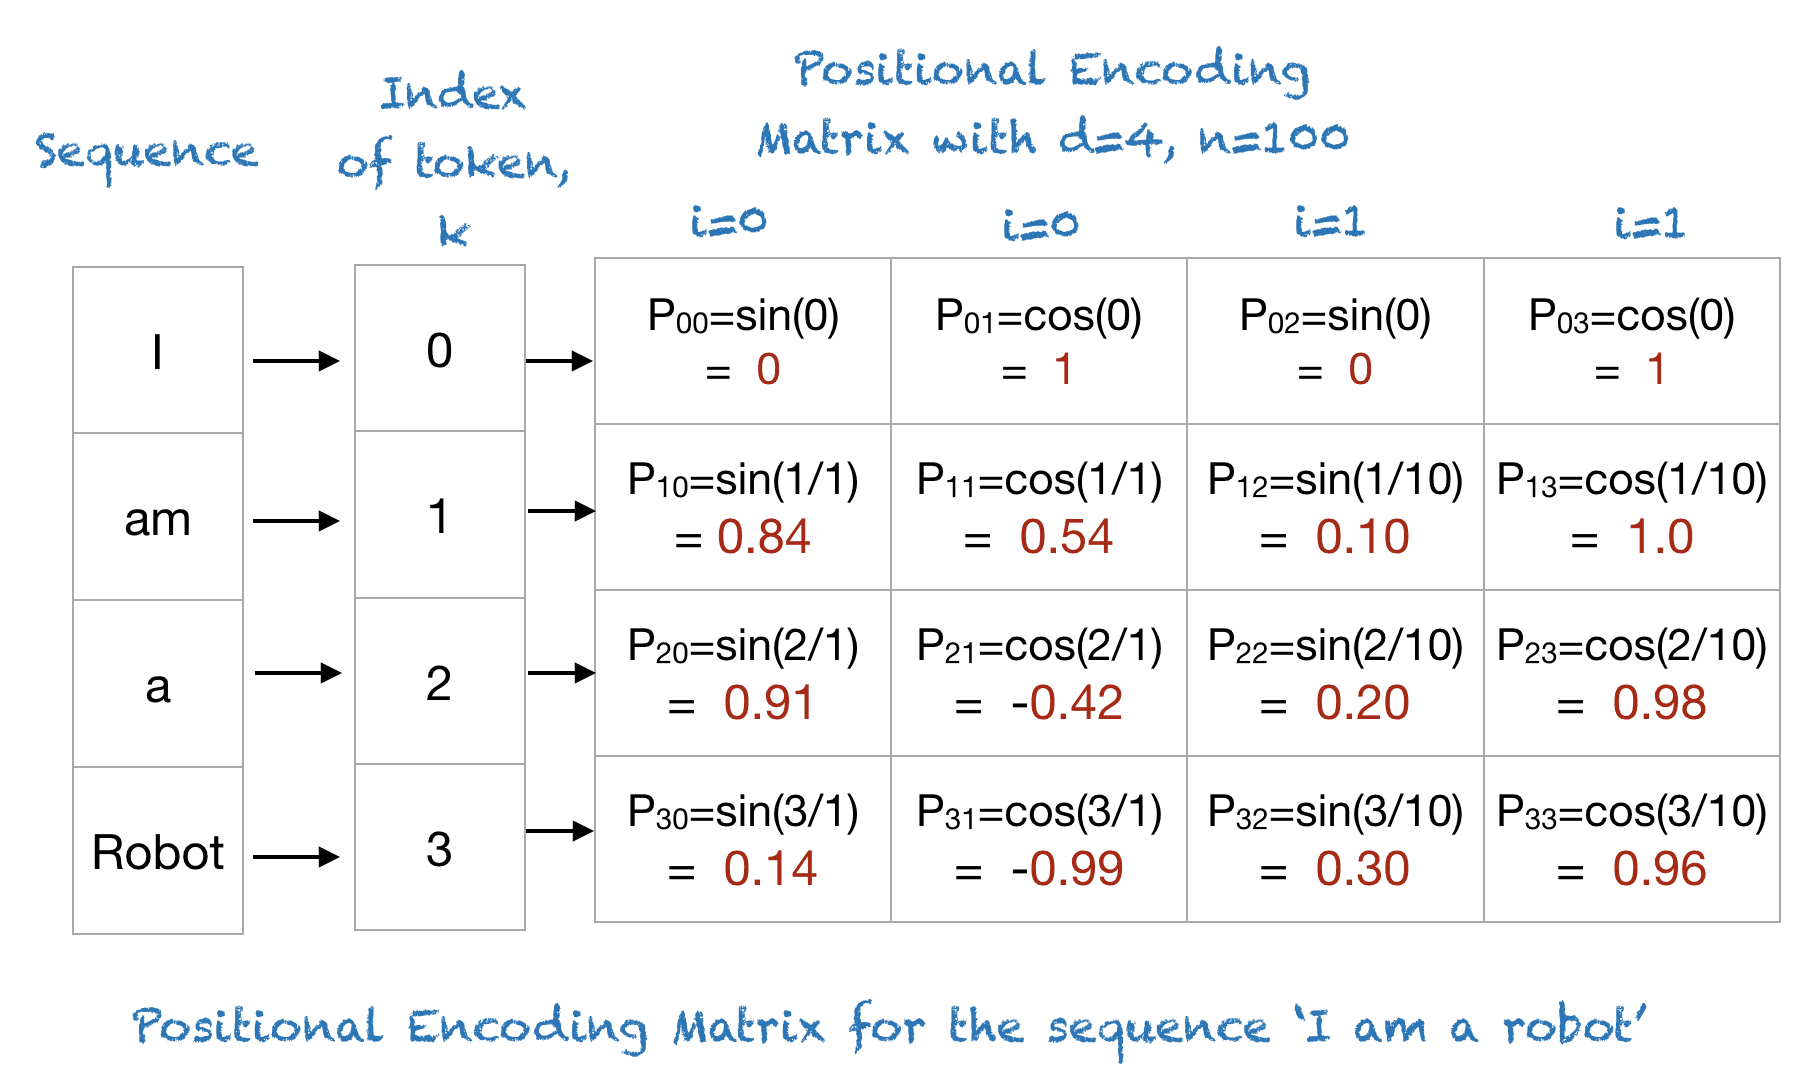
Figure 1: Positional encoding
Positional encoding matrix
import sys
import readline
import torch
import readline
import numpy as np
import matplotlib.pyplot as plt
def getPositionEncoding(seq_len, d, n=10000):
    P = np.zeros((seq_len, d))
    for k in range(seq_len):
        for i in np.arange(int(d/2)):
            denominator = np.power(n, 2*i/d)
            P[k, 2*i] = np.sin(k/denominator)
            P[k, 2*i+1] = np.cos(k/denominator)
    return P
P = getPositionEncoding(seq_len=4, d=4, n=100)
print(P)
print(readline.__doc__)
[[ 0.          1.          0.          1.        ]
 [ 0.84147098  0.54030231  0.09983342  0.99500417]
 [ 0.90929743 -0.41614684  0.19866933  0.98006658]
 [ 0.14112001 -0.9899925   0.29552021  0.95533649]]
Importing this module enables command line editing using GNU readline.
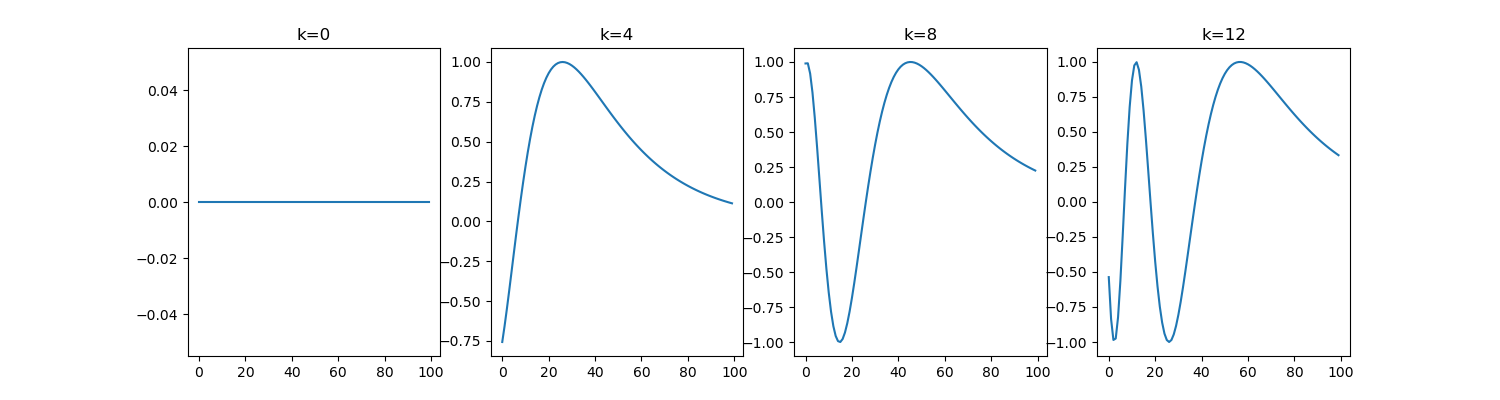
sine wave for different positions with n = 10000 and d = 512
def plotSinusoid(k, d=512, n=10000):
    x = np.arange(0, 100, 1)
    denominator = np.power(n, 2*x/d)
    y = np.sin(k/denominator)
    plt.plot(x, y)
    plt.title("k=" + str(k))
fig = plt.figure(figsize=(15, 4))
for i in range(4):
    plt.subplot(141 + i)
    plotSinusoid(i*4)
fname = 'images/sinusoid.png'
plt.savefig(fname)
fname